Trump’s steel and aluminium tariffs: A problem for some products
Written by: Mattia Di Ubaldo, Anupama Sen
You will have read many columns in the past weeks on the wild and unstable tariff-hikes announced by the Trump 2.0 administration. Yet, only a fraction of these announcements was effectively implemented. Here we look at one of them, the steel and aluminium tariffs, and try to gauge their relevance for UK exporters.
Let us start by recalling the core elements of the policy. On March 12th the US applied new and higher import tariffs on steel and aluminium products from all countries. These tariffs expand the existing “Section 232” tariff programme on steel and aluminium, first applied in 2018 by the Trump 1.0 administration, in three main ways:
- all existing exemptions and special arrangements were closed. After the application of Section 232 tariffs in 2018, several countries reached arrangements with the US to be fully or partly exempt from these taxes. The UK benefited from tariff-rate quotas on both steel and aluminium but this arrangement, together with those of several other countries (including, among others, the EU, Canada, Mexico, Japan, and Australia) was now terminated.
- tariffs on aluminium products were increased from 10% to 25%
- tariffs were expanded to cover several products containing steel and aluminium, i.e. derivatives produced in downstream industries.
The third point is particularly noteworthy, as it extends the tariffs to a long list of products such as parts and components of machinery, aerospace, furniture, sports equipment, etc, accounting for a relatively large volume of trade. In total, we identified 1,323 product lines at the HTS 10-digit level that will be affected by the tariffs, with 835 being “raw” steel and aluminium products (we refer to all the products not listed as a derivative in the Presidential declarations as a raw product) and 488 being derivative products.
To get a sense of the magnitudes, in 2024 the US imported $60.8 billion in goods from the UK (US ITC data). Out of these, the value affected by the tariffs is $3.43 billion, i.e. about 5.6% of the total. This can be separated in the value accounted for by raw steel and aluminium products, $608 million (1% of the total), and the value of derivative products, $2.85 billion (4.6% of the total).
These are not huge trade shares, especially considering that the tariffs will not apply to the whole $3 odd billion. The raw products will get the full 25% tariff hike. For certain derivatives, those not classified in HS chapters 73 and 76, only the steel and aluminium content will be subject to the tariff. It turns out that these derivatives are by far the most valuable ones, accounting for $2.25 billion in US imports from the UK. This might appear as a relief, on the one hand, as only a fraction of the $2.25 billion will suffer a tariff increase. On the other hand, to avoid the tariff applying to the full value of the product, firms will have to be able to declare the value (and the weight!) of the steel and aluminium embedded in the derivative. This will cause some headaches, considering the complexity of modern supply-chains, but avoiding a large tariff surcharge could be a strong enough incentive for firms to invest some time (i.e. extra costs) to try to report the steel and aluminium content accurately.
What do more detailed numbers say?
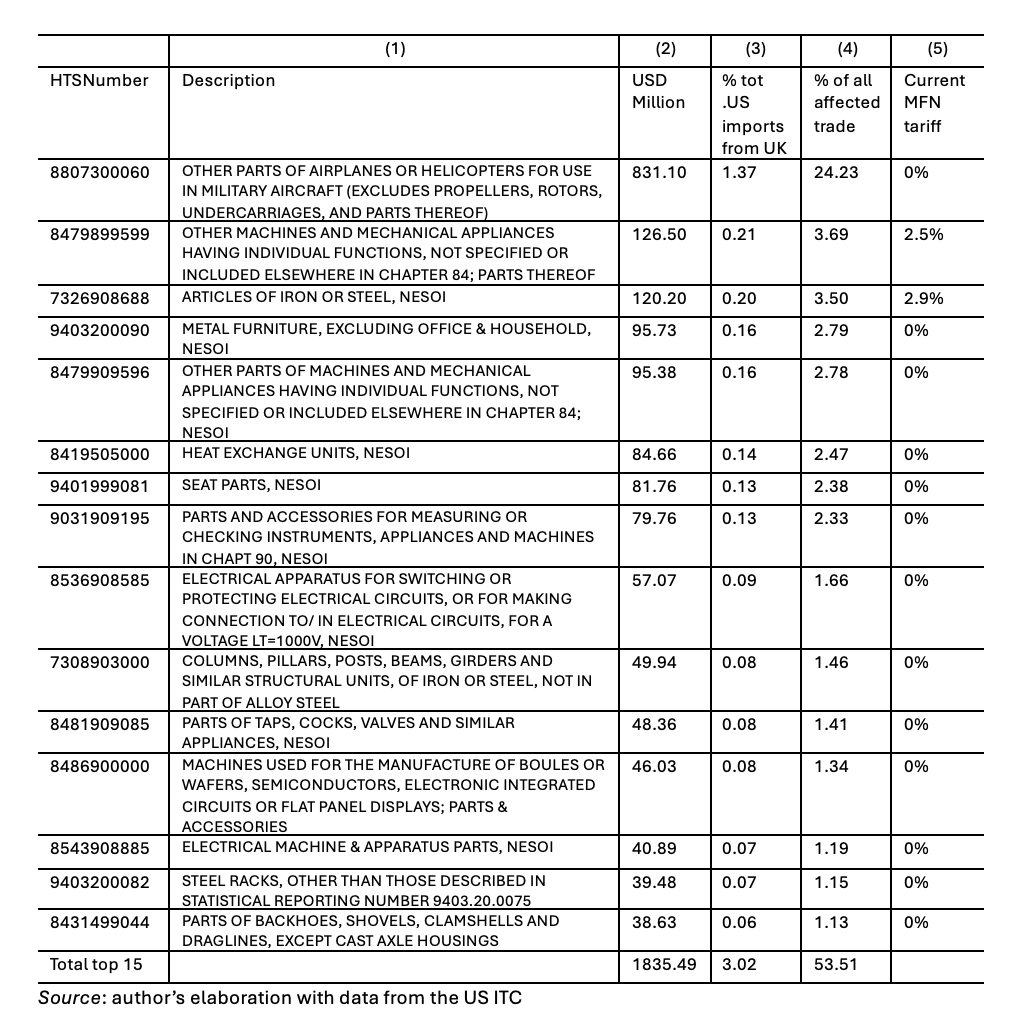
To see where the tariffs are going to bite, and understand their impact, Tables 1 and 2 present the top15 raw and the top15 derivative products, among those affected by the tariffs, in terms of their share of total US imports from the UK (column 3). We also report the total value imported (column 2), their share out of total affected imports (i.e. the $3.43bn), and the current US MFN tariff. First, note that for most products the current US MFN tariff is zero: a 25% increase will come as a large shock. However, the second and main aspect to note is that for both raw and derivative products the top15 account for a large fraction of their respective totals: 490m/608m=80% and 1.83bn/2.85bn=64%. This suggests that a few products will take the brunt of the impact of these tariffs. A prime example is “Other parts of airplanes or helicopters for military use (HTS Number 8807300060), with an import value of $831 million, accounting for 24% of all affected UK exports to the US.
Table 1: Raw steel and aluminium products most affected by the tariffs
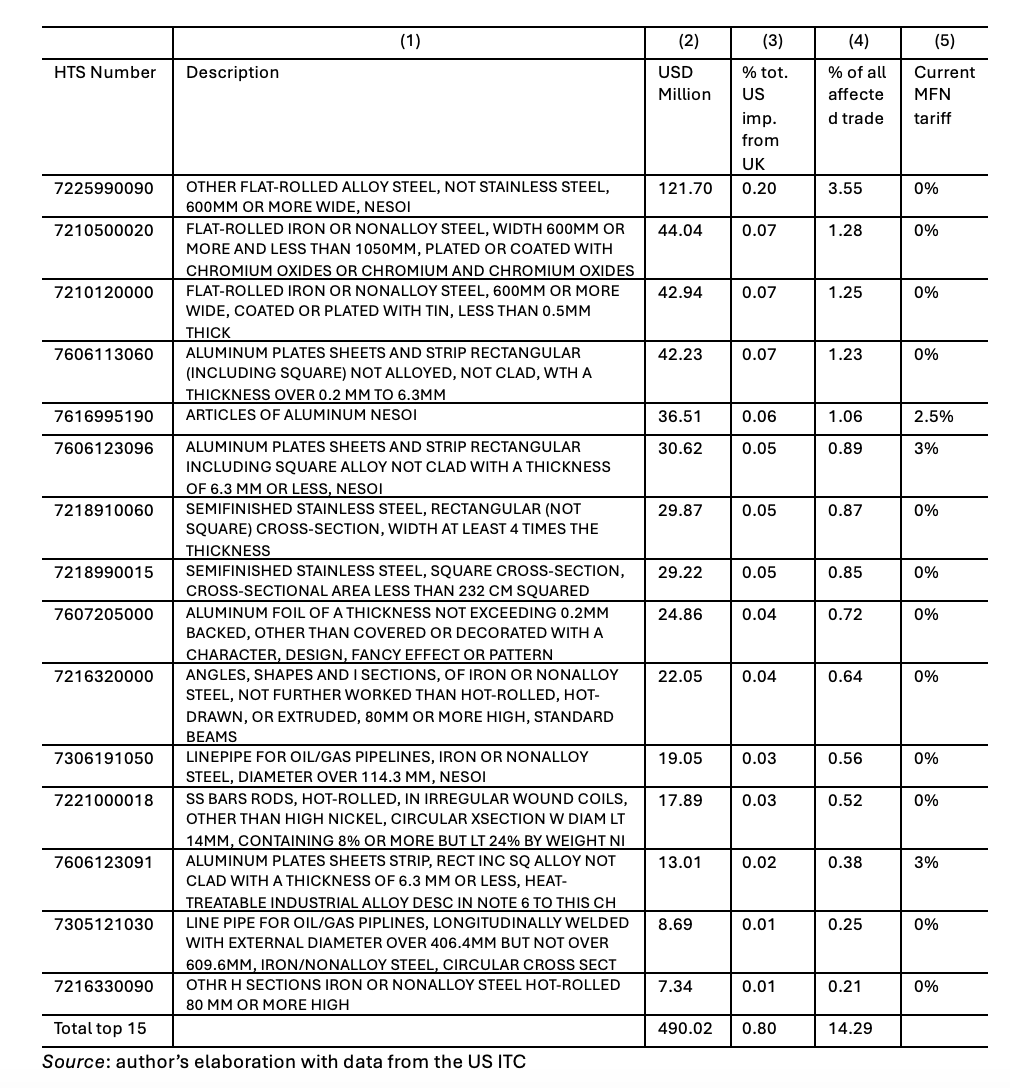
Table 2: Derivatives of steel and aluminium products most affected by the tariffs
We then go one step further and try to assess how relevant the affected products are in UK exports to all countries, and the share going to the US out of that. For this we use data from the World integrated Trade System (WITS) for 2024. However, as in WITS the finest detail available is the 6-digit HS level, (more aggregated than the 10-digit level at which the tariffs apply), we need to introduce a ‘correction’ to the WITS data. We re-scale the HS-6-digit data using the share of US imports from the UK affected by the tariff in the 6-digit group – for example, if all the 10-digit lines within a 6-digit group are affected by tariff, the share will be 1. We compute this share with US ITC data, and assume the same share roughly applies to UK exports to other countries as well. This is an imperfect fix, but it does an OK job, at least in replicating the US import figures with UK exports data. UK exports affected by the tariffs are found to be 3.81bn, which make up 6.29% of total UK exports to the US (compare these with the 3.34bn and 5.6% mentioned above).
Based on the data, we find that the UK exports of affected products to the rest of the world (ROW) are worth $20.71 billion. The US accounts for 3.81bn/(3.81bn+20.71bn) = 15.5% of the total. This is a non-negligible share: while affected products are not a large share of total UK exports to the US, for the affected products the US is a relatively important market.
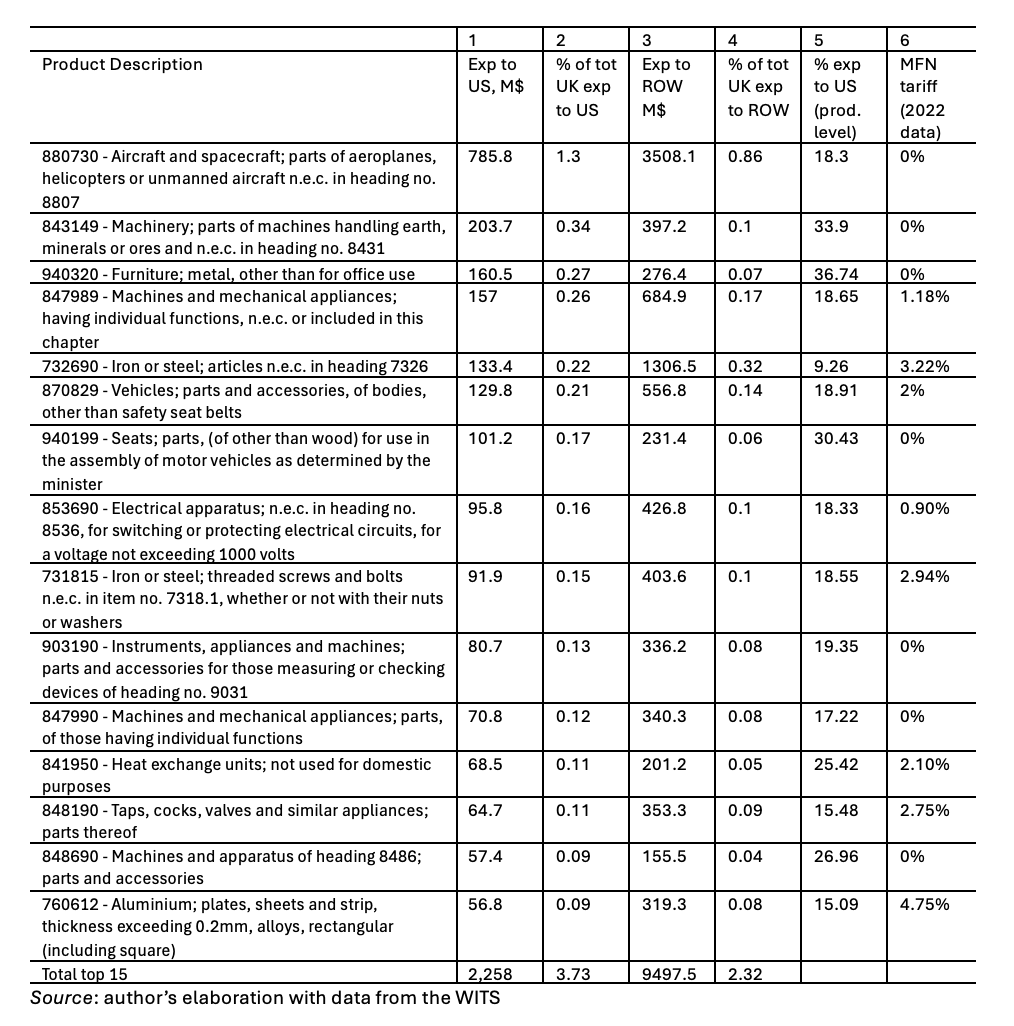
Tables 3 and 4 provides more details. Table 3 highlights the top15 (‘rescaled’) HS-6 products affected by the tariffs, again in terms of their share of total UK exports to the US – we don’t distinguish between raw and derivatives here. It is important to note that the ranking appears somewhat different than in Tables 1 and 2, as we now rank HS6 groups, rather than 10-digit products.
In addition, the table shows the value exported to the ROW and the share of each product out of the total, as well as the significance of the US market for each product in column 5 (the shares exported to the US out of each product’s total). Column 6 reports the simple average of US MFN tariffs applying to the 6-digit group.
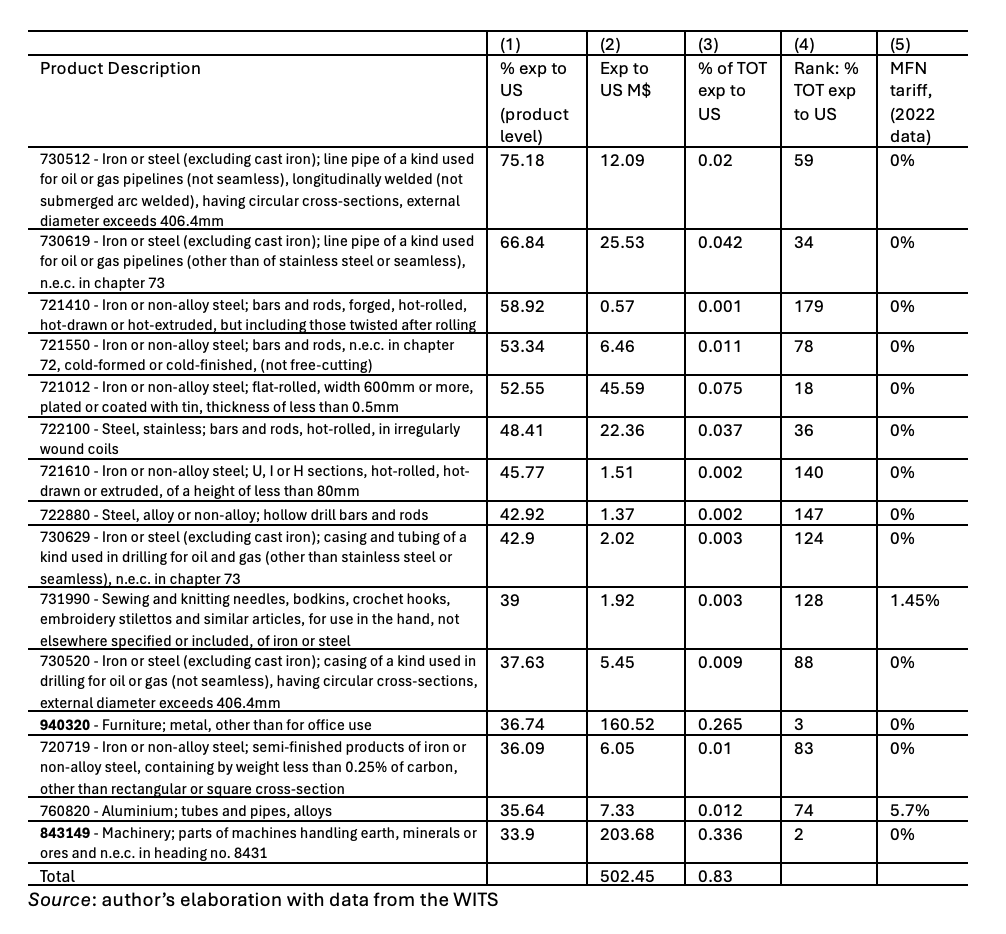
Column 5 reveals that for many affected products, the US is indeed a relevant market, with the share ranging from 9.26% to 36.7%. To corroborate this finding Table 4 reports the top15 products ranked according to this statistic: product 730512 is the most dependent on the US market, with 75% of UK exports going to it.
Lastly, Table 4 also shows the rank of each product based on their share of total UK exports to the US (column 4). This allows us to spot a couple of products (843149 and 940320) for which the tariffs are particularly problematic. These products have both a high dependence on the US, and they are relatively relevant in the UK’s trade.
Table 3: Most affected products: relevance for UK exports to ROW and dependence on the US
What should we make of these numbers? The US is an important trading partner, but the overall relevance of the products affected by Section 232 tariffs for the UK is modest. While tariffs are an issue for products with a high dependence on the US, we find less than a handful that are exported in meaningful amounts.
Table 4: top 15 products in terms of their dependence on the US market
Disclaimer:
The opinions expressed in this blog are those of the authors alone and do not necessarily represent the opinions of the University of Sussex or the UK Trade Policy Observatory.
Republishing guidelines:
The UK Trade Policy Observatory believes in the free flow of information and encourages readers to cite our materials, providing due acknowledgement. For online use, this should be a link to the original resource on our website. We do not publish under a Creative Commons license. This means you CANNOT republish our articles online or in print for free.